

How to Build a SaaS Metrics Dashboard for Board Reporting That Investors Trust
Author: Carla Anderson Skogland, Founder & Partner - FinUp Partners

Most investors reject board decks because the numbers don't reconcile to financial statements. They trust dashboards that show consistent definitions, clean data lineage, and decision-ready insights over flashy visualizations that mask unreliable data.
Here's the reality: building a SaaS metrics dashboard for board reporting means creating a single source of truth that aligns your operating metrics to your financial model. You'll learn the exact metric definitions and governance practices that experienced operators use to structure investor dashboards that boards actually rely on.
FinUp Partners brings fractional CFO expertise to help you stand up investor-ready reporting that builds trust and speeds decisions in every board meeting.
What Is a SaaS Metrics Dashboard for Board Reporting?
Understanding the SaaS metrics dashboard for board reporting definition starts with recognizing it's fundamentally different from generic business dashboards. This is a single, reconciled view that tracks your company's growth, efficiency, and retention using the 5-7 core KPIs that SaaS investors expect: ARR growth, net dollar retention, customer acquisition cost, lifetime value, and burn multiple. Unlike internal operational dashboards that might show dozens of metrics, board dashboards focus on metrics that drive strategic decisions. The dashboard presents these with clear trends, variance to plan, and targets so board members can assess performance at a glance. As BVP's CFO playbook emphasizes, the goal is providing a "forward-looking view" that enables productive board discussions rather than reactive explanations.
The key to achieving this clarity is building from a governed data model that reconciles to your financial statements, not ad hoc spreadsheets that create confusion in the boardroom. Your metrics must tie back to the general ledger with clear definitions and consistent methodology month over month. For example, if your dashboard shows $2M in new ARR but your financial statements reflect different revenue recognition timing, you'll spend the entire board meeting explaining discrepancies instead of discussing strategy. This means establishing data lineage, standardizing calculations, and ensuring your CFO services team owns the process from data collection to presentation. Board reporting best practices recommend automating data flows wherever possible and maintaining a single source of truth to prevent the metric disputes that derail productive board meetings.
SaaS Board Reporting Best Practices: Governance, Cadence, And Source Of Truth
Trusted board reporting starts with locked metric definitions and a single source of truth. Create a one-page metric glossary that defines exactly how you calculate ARR, churn, CAC, and other core metrics. Use standardized definitions from resources like the SaaS Metrics Standard Boardto avoid confusion. Once you publish these definitions, resist the urge to change them mid-quarter unless there's a compelling business reason.
Monthly reconciliation between your dashboard metrics and general ledger builds the trust that keeps board meetings focused on strategy, not data disputes. Revenue recognition, cash flow, and customer counts must tie back to your financial statements within reasonable ranges. Establish a repeatable close-to-dashboard cadence where your metrics update within five business days of month-end, with board materials delivered 24 hours before the meeting. This consistent approach consistent approach gives directors time to review and come prepared with strategic questions rather than data clarifications.
Real-Time SaaS Dashboard Metrics: What Must Update Continuously
Not every metric needs to update hourly. Smart real-time SaaS dashboard metrics focus on leading indicators that help you spot trends and intervene fast, while keeping lagging financial metrics stable until month-end.
Focus your continuous updates on these leading indicators:
- Pipeline coverage and new bookings sync daily to catch momentum shifts early.
- Product adoption metrics like DAU, feature usage, and onboarding completion track moment-to-moment.
- Customer health scores and support ticket volume trigger automatic alerts for at-risk accounts.
- Sales activity metrics including demos, trials, and proposal status update live.
- Churn spikes and CAC drift hit preset thresholds that notify your team instantly.
Reserve GAAP revenue recognition and cash reconciliation for your monthly close process. This prevents noise from timing differences and keeps your board focused on trends, not daily fluctuations. Your investors trust dashboards that separate actionable signals from accounting precision.
Investor-Ready SaaS KPI Visualization: Make The Story Obvious
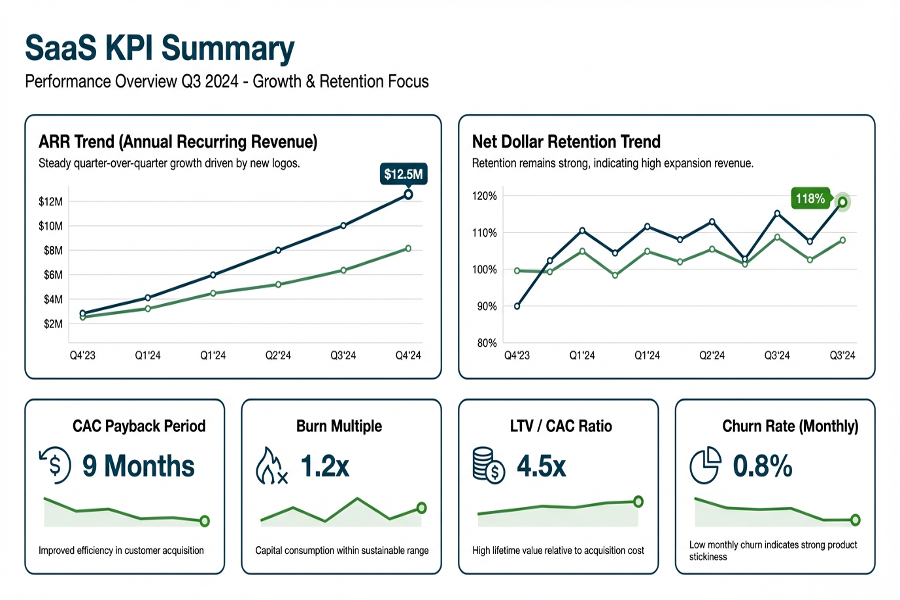
Your board wants to see the business health in 30 seconds, not 30 slides. Start every investor-ready SaaS KPI visualization with a one-page executive summary that shows growth (ARR, new bookings), efficiency (CAC payback, burn multiple), and retention (net dollar retention, logo churn) side by side. Research analyzing 370 board meetings shows that the most effective dashboards lead with red-yellow-green status indicators and focus on strategic decisions rather than historical deep dives. This approach lets directors quickly identify what needs attention and spend meeting time on strategy, not data interpretation.
Visual consistency builds trust faster than fancy charts. Use the same time periods across all metrics, show both year-over-year and sequential trends, and always include variance to your plan or forecast. Limit yourself to two colors and three chart types maximum. When you see an inflection point in churn or a CAC spike, add a simple annotation explaining the cause. Top-tier VCs recommend this approach because it eliminates the guessing game that derails productive board conversations and keeps everyone focused on what drives the business ahead.
MRR And ARR Tracking For Board Meetings: Accurate, Auditable, Actionable
Effective MRR and ARR tracking for board meetings starts with a clean waterfall breakdown that separates new, expansion, contraction, and churn components. Each ARR movement must tie back to signed contracts in a contract-level spreadsheet that your finance team can audit monthly, building trust because board members can see exactly how you moved from starting ARR to ending ARR without black box calculations. The revenue waterfall becomes your single source of truth for explaining growth momentum and retention health.
Align your ARR cohorts to meaningful business segments like enterprise versus SMB, product lines, or geographic regions to expose concentration risks that matter to investors. A single customer representing 15% of ARR or one product driving 80% of expansion tells a story your board needs to hear. Use stage-appropriate templates that match your company size and complexity rather than building complex reports that hide the key drivers. This segmented view helps boards understand where growth is sustainable and where you need to diversify.
Churn Analysis For SaaS Board Reports: Retention You Can Defend
Boards need specific retention metrics with clear formulas and segmentation to assess risk and growth potential. Here's what makes churn analysis credible in investor meetings.
- Report both logo churn and revenue churn with explicit formulas in your appendix.
- Show gross retention GRR and net retention together so boards see both risk and expansion.
- Segment churn by customer cohort, ACV band, and reason codes.
- Track leading indicators like product adoption scores, NPS trends, and support ticket volume.
- Use trailing averages to smooth seasonal noise and highlight true retention trends.
When your churn analysis connects the dots between customer behavior and the revenue impact, boards can make informed decisions about where to invest retention efforts.
Customer Acquisition Cost (CAC) Dashboard: Efficiency At A Glance
Investors spot incomplete CAC reporting immediately when costs are understated or key channels are missing. Your customer acquisition cost (CAC) dashboard needs to show the complete picture, not just ad spend.
- Include fully loaded costs- salaries, tools, overhead, programs by channel and segment for apples-to-apples comparisons.
- Track CAC payback under 12 months - investors expect)this timeline with 3:1 LTV:CAC ratios.
- Show pipeline coverage and win rates - explain why CAC moved up or down with sales context.
- Segment by customer type - enterprise vs SMB CAC tells different efficiency stories.
- Align sales cycle to CAC windows - longer cycles skew CAC accuracy if expense timing doesn't match conversion periods.
CAC dashboards that connect acquisition costs to payback periods and pipeline health give boards confidence in your unit economics. This becomes especially powerful when CFO expertise ensures the math reconciles to your financial model and growth strategy.
Lifetime Value (LTV) Insights For Boards: Sensitivity And Reality Checks
Boards lose trust fast when LTV calculations rely on optimistic churn assumptions or ignore gross margin reality. Build your LTV model using observed retention data from actual cohorts, not projected improvements that may never materialize. Factor in your true gross margin after hosting, support, and customer success costs. A $100 monthly customer with 70% gross margin and 5% monthly churn delivers $1,400 LTV, not the $2,000 you get ignoring margin. This accuracy builds credibility when investors verify your calculations.
Present LTV with sensitivity ranges that show both risk and upside scenarios to give boards the full picture. Test your LTV calculations with churn rates 20% higher and lower than current, plus expansion scenarios if you have negative net churn. Break out unit economics by customer segment, deal size, or acquisition channel rather than averaging everything together. A $50K enterprise deal and a $500 SMB subscription have completely different lifetime values and risk profiles. Cohort-level reporting shows which segments actually drive profitable growth and which ones destroy value.
SaaS Financial Metrics Transparency: From Metrics To Model To Cash
Boards lose trust when operating metrics feel disconnected from financial reality. The best SaaS financial metrics transparency comes from showing exactly how your KPIs drive cash burn and runway.
- Map each operating metric to cash impact with specific scenarios, like how a 20% CAC increase reduces 18-month runway to 15 months.
- Create a one-page metric definitions appendix with data sources and calculation methods to eliminate meeting debates.
- Present burn multiple Rule of 40 and path to profitability on the same view for clear tradeoff discussions.
- Reconcile operating KPIs to GAAP revenue and cash flow statements monthly to maintain credibility.
- Use standardized formulas for LTV, CAC payback, and retention calculations across all board materials.
This level of SaaS financial metrics transparency builds the foundation for productive board conversations about growth investments versus efficiency. When metrics connect clearly to cash and outcomes, strategic decisions happen faster.
Customizable Dashboard Templates For SaaS: Scale Without Rework
Here's what works: build your customizable dashboard templates for SaaS from a single, governed data source that feeds multiple role-based views. Your board summary shows the top 10 KPIs at a glance, while your CEO deep dive includes cohort analysis and pipeline details. Create functional tabs for sales, marketing, and product teams using the same underlying data model. You avoid version control nightmares when everyone sees consistent numbers from the same source. Sequoia Capital recommends reusing operational materials for board packs to maintain consistency across stakeholder communications.
Set up parameterized filters for segment, product line, and region. Monthly updates then require zero rebuilds. Configure dropdown menus that automatically refresh charts and tables when you select different time periods or customer cohorts. Standardize your pre-read pack structure with a cover page, executive summary, core KPI pages, and appendix. Kellblog's approach to the first three slides creates a repeatable template that works across funding stages. This governed approach lets your fractional CFO spend time on analysis, not data wrangling, while you distribute the pack 24 hours before meetings.
Benchmarking SaaS Performance For Investors: Context Beats Claims
Raw metrics without context leave boards guessing whether your performance is strong or concerning. Strategic benchmarking shows where you stand against peers and top performers.
- Compare key ratios against your ARR band and ACV segment using sources like BVP Atlas for stage-appropriate expectations.
- Display quartile ranges, not just medians, so boards see if you're tracking toward top 25% performance.
- Segment retention benchmarks by customer size since NRR varies significantly across ARPA bands.
- Flag metric gaps when benchmarking SaaS performance for investors with specific improvement plans tied to expected movement and timeline.
- Reference current industry standards like 2025 benchmarks showing median CAC payback and burn multiples.
Benchmarking transforms defensive conversations into strategic discussions about path to top quartile performance. Your board wants to see progress against the best, not just month over month improvement.
Build Trust, Make Decisions, Win Your Next Round
A disciplined SaaS metrics dashboard transforms board meetings from data debates into strategic conversations. When your numbers reconcile to the GL and tell a clear story, investors focus on growth opportunities instead of questioning your reporting. Companies with these board reporting best practices get funded faster than those that struggle with messy data.
Building this level of reporting excellence requires experienced financial leadership. These ten dashboard components we walked through create the foundation for investor trust and faster decision-making. FinUp Partners brings fractional CFO expertise to help you build these systems quickly, reconcile your dashboard to your financial statements, and coach you through your next fundraising round.
Ready to build a SaaS metrics dashboard that investors trust? FinUp Partners delivers fractional CFO leadership to get your board reporting investor-ready fast.
FAQ: SaaS Metrics Dashboard For Board Reporting
Building your first investor-ready dashboard while preparing for a funding round raises urgent questions about what metrics matter most, how to avoid credibility gaps, and which tools won't slow you down. Here are the most common questions founders ask when preparing board-ready metrics that build trust and drive decisions.
What KPIs must be on the first page for a seed to Series B SaaS board?
Start with ARR growth, net dollar retention, customer acquisition cost, and months to recover CAC. Add gross revenue retention, burn multiple, and cash runway. According to Bessemer's CFO playbook, your opening slide should show growth trajectory and unit economics health at a glance.
How do we avoid metric disputes between finance, sales, and product?
Create a single-page metric glossary with formulas and data sources. Finance owns the definitions; sales and product provide input but cannot change calculations mid-quarter. Stripe's metrics guide provides standard formulas that prevent confusion. Freeze metric definitions at quarter-start and communicate changes only between board cycles.
What refresh cadence works best for investors and internal operators?
Update pipeline and bookings daily for operators, but limit board dashboards to monthly closes. Investors want consistency over speed. SaaS Metrics 2.0 recommends daily operational views for MRR waterfalls and monthly board packages. Deliver board materials within five business days of month-end with a 24-hour pre-read window.
How should we handle one-time events so trends stay clean and credible?
Show one-time items separately, never buried in core metrics. Use clear annotations like "Q2 includes $50K contract adjustment" so boards see clean trends underneath. Use cohort views to isolate normal behavior from anomalies. Never adjust historical numbers without clear disclosure and board approval.
Which tools and data sources are easiest to operationalize quickly?
Start with your CRM and billing system as primary sources, then layer in spreadsheet-based calculations. Avoid complex BI tools until you have stable definitions and processes. Export raw data monthly, build calculations in Google Sheets or Excel, then move to automated tools once your metrics are proven and trusted by working with experienced fractional CFO support.